Documentation Index
Fetch the complete documentation index at: https://guide.cloud.blnkfinance.com/llms.txt
Use this file to discover all available pages before exploring further.
Overview
Insights give you a clear view of what’s happening across your ledger. They provide quick, visual reports on balances, transactions, identities, etc. so you can monitor activity at a glance.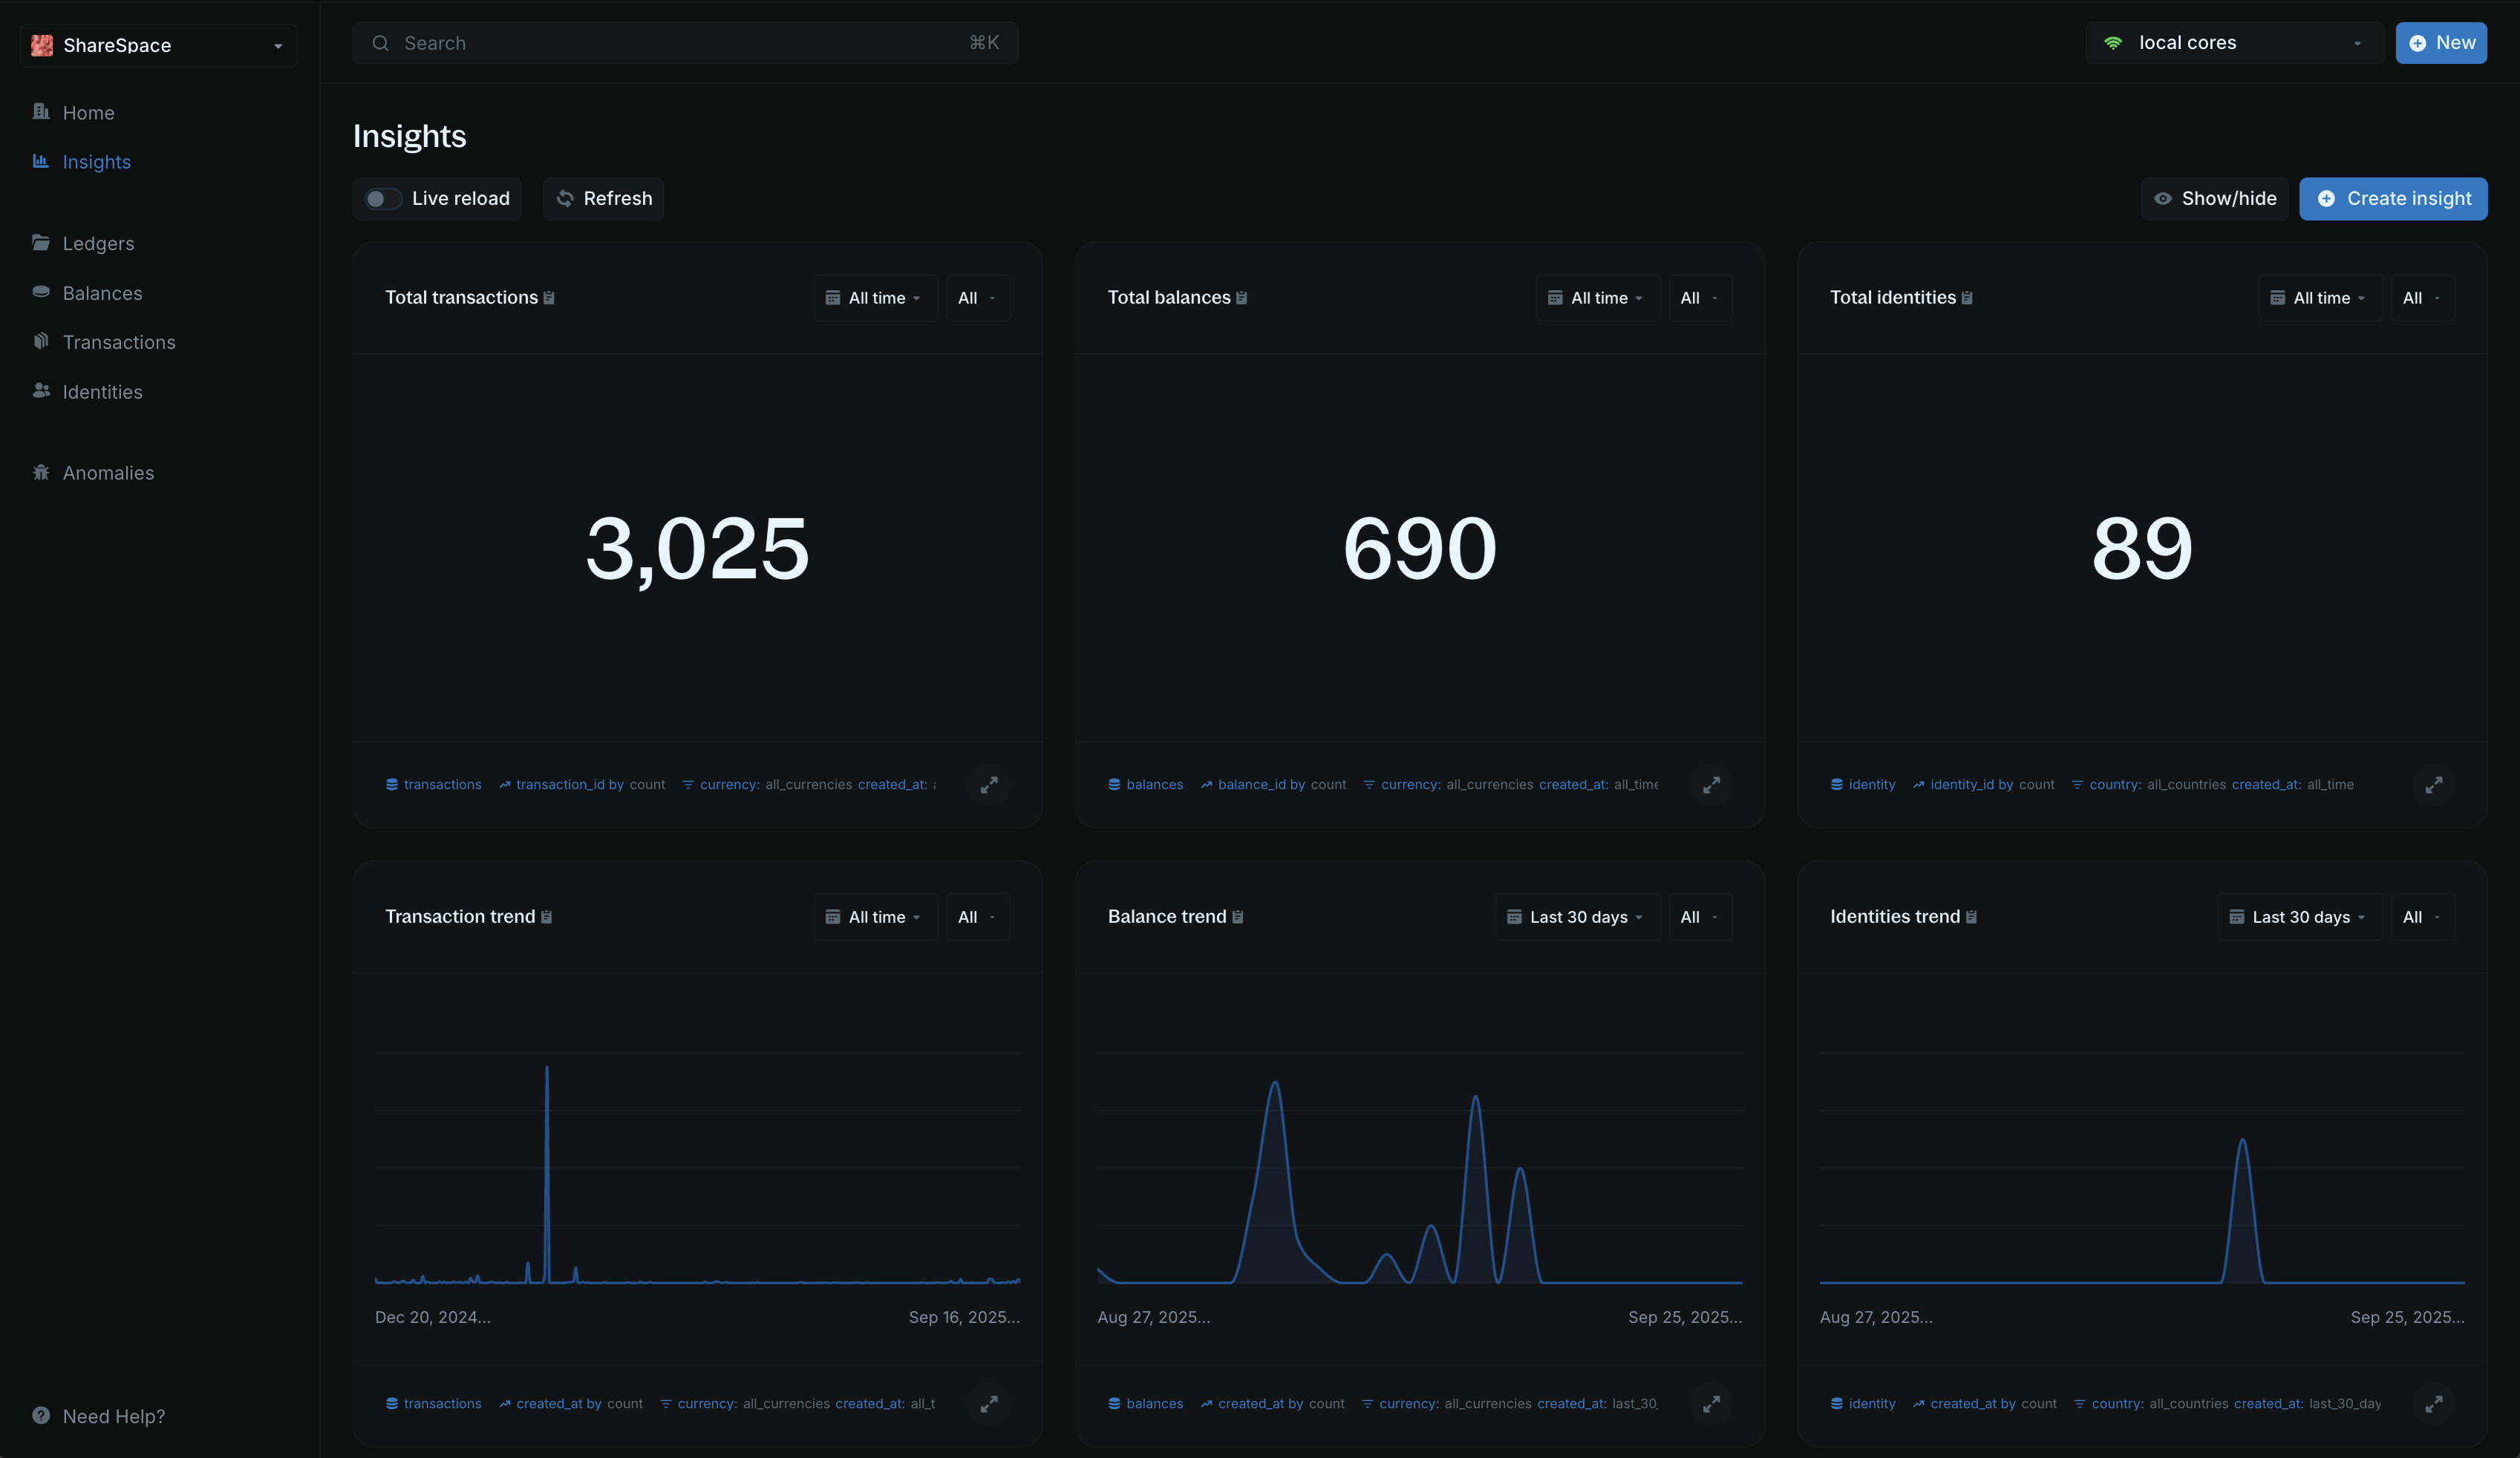
Working with insights
Default visualizations
When you connect your Core, Blnk generates six visualizations for you by default:- Total transactions — the total number of transactions recorded.
- Total balances — the number of balances created in your ledger.
- Total identities — the number of identities registered.
- Transaction trend — how transactions have changed over time (last 30 days by default).
- Balance trend — the growth of balances over time.
- Identities trend — the growth of identities over time.
Live reload
Turn on Live reload to automatically refresh your visualizations with the latest data every 10 seconds.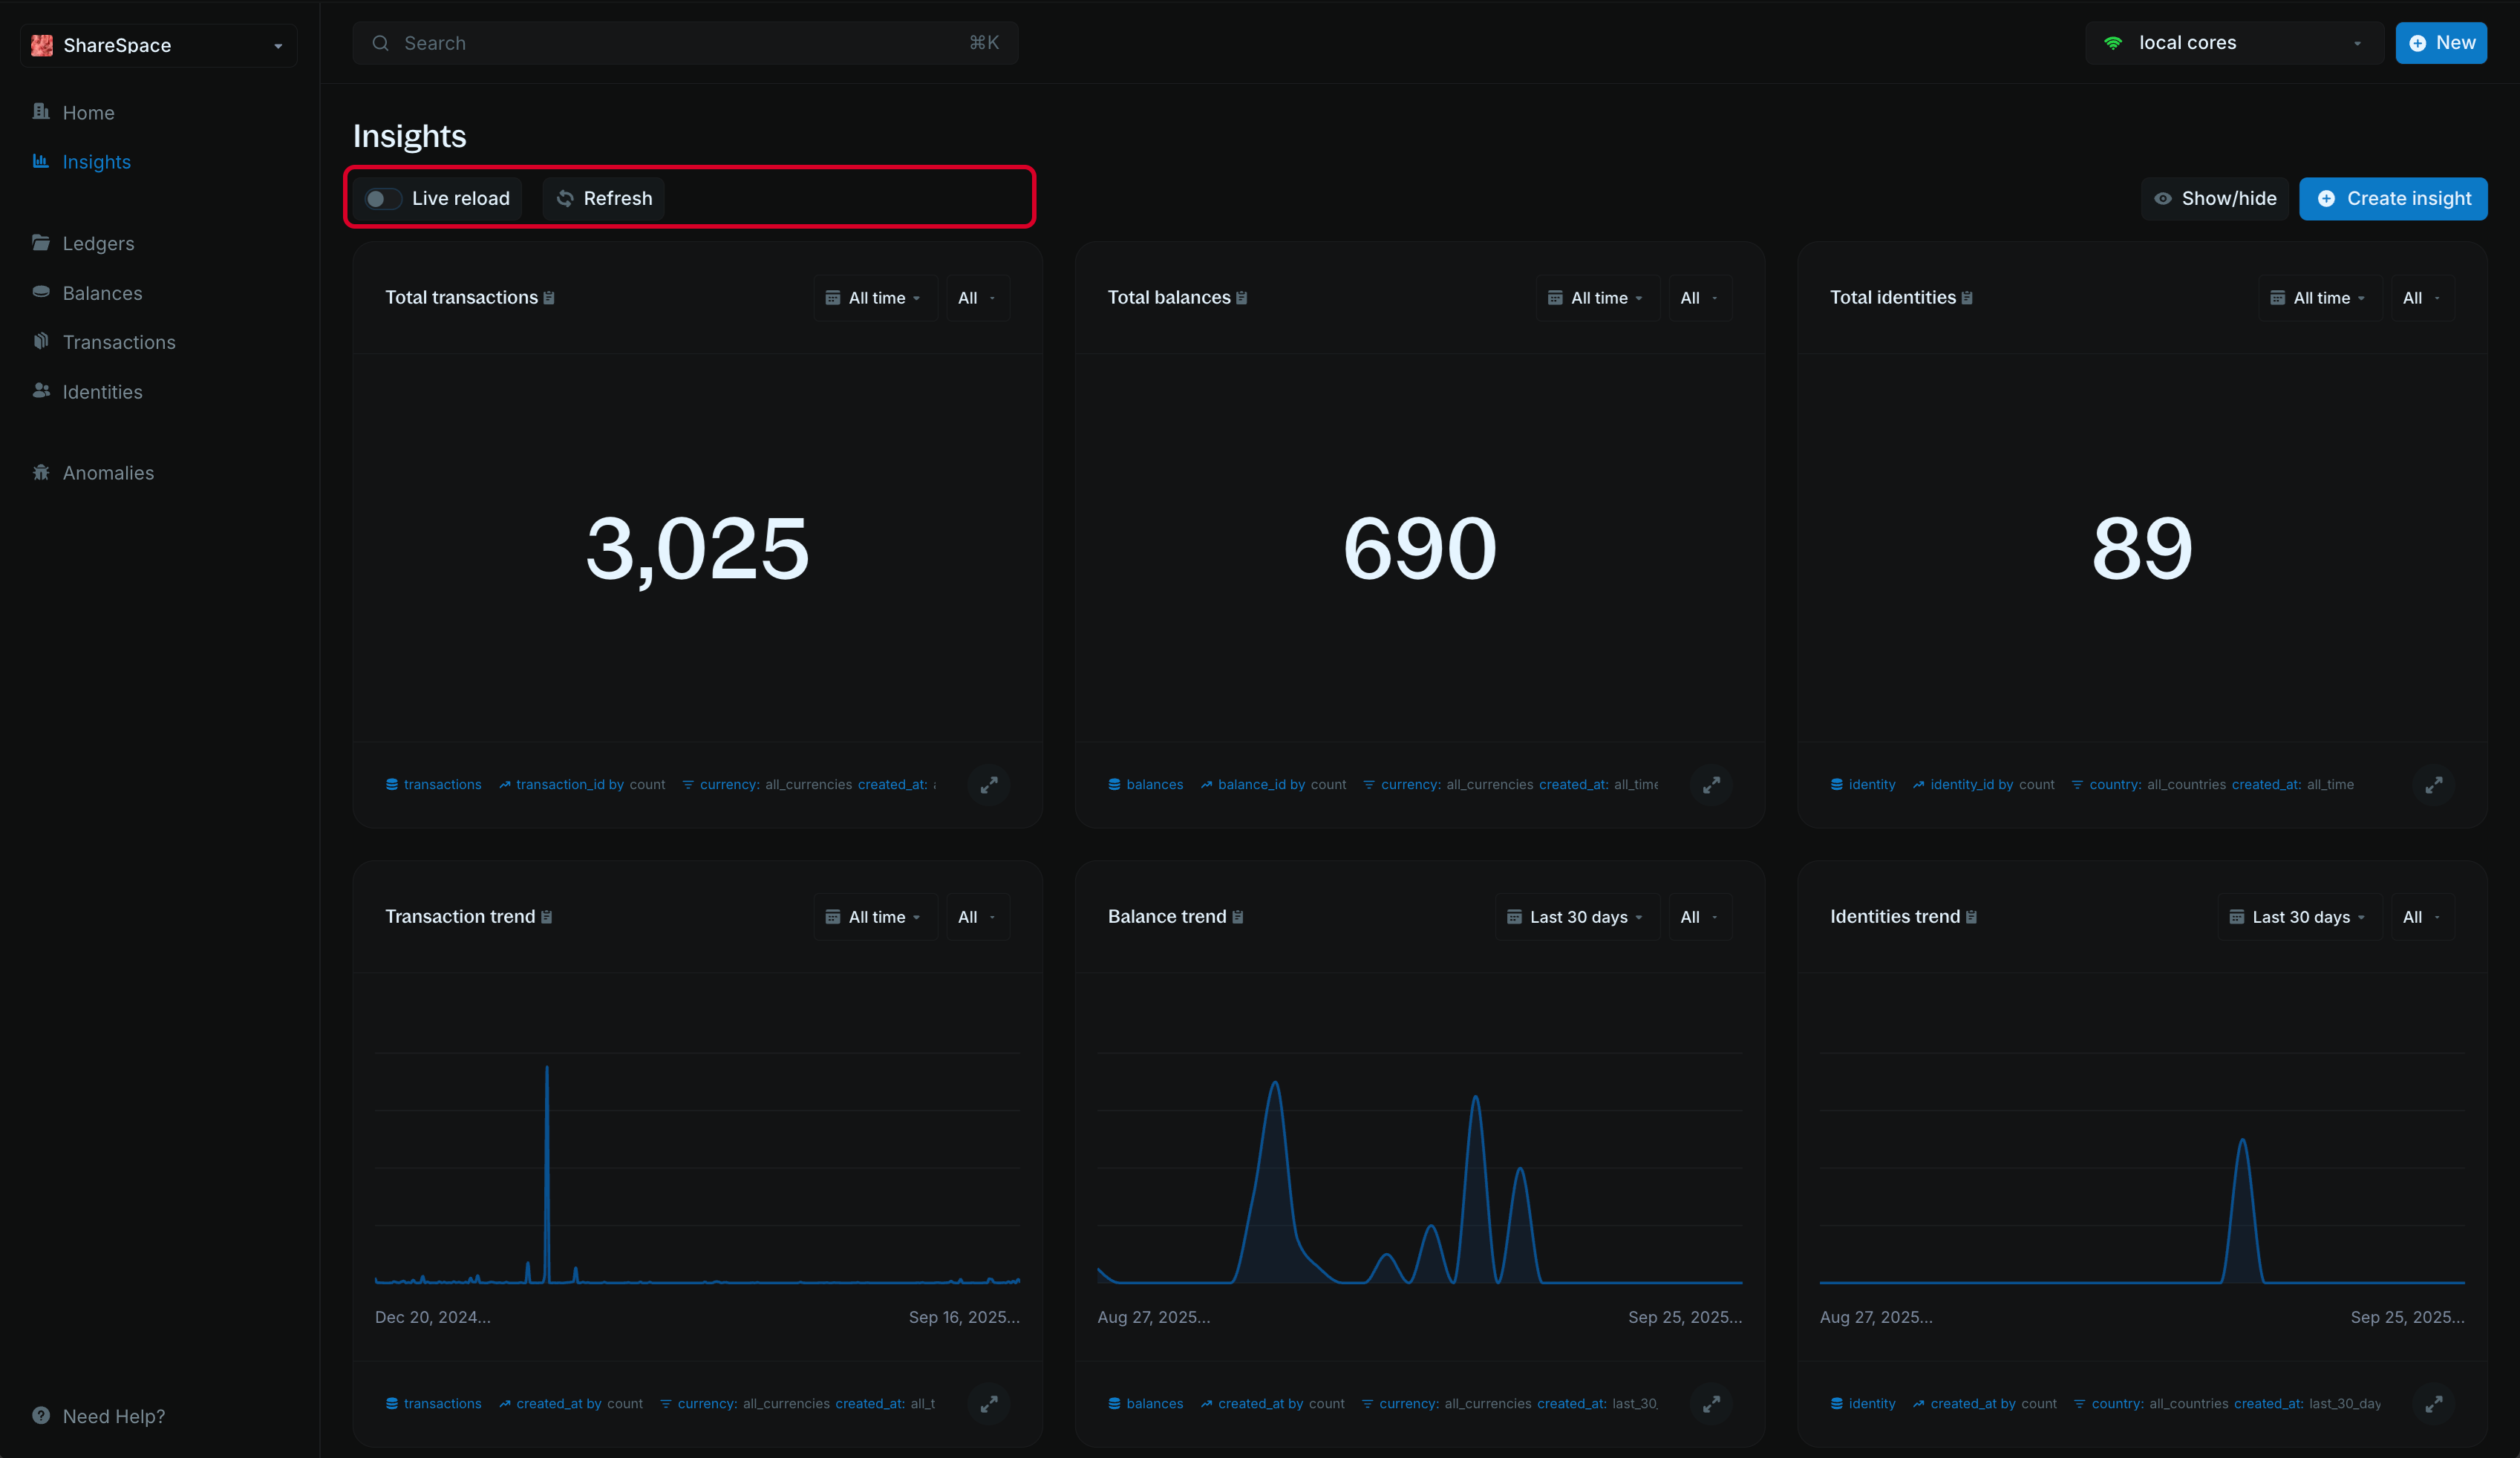
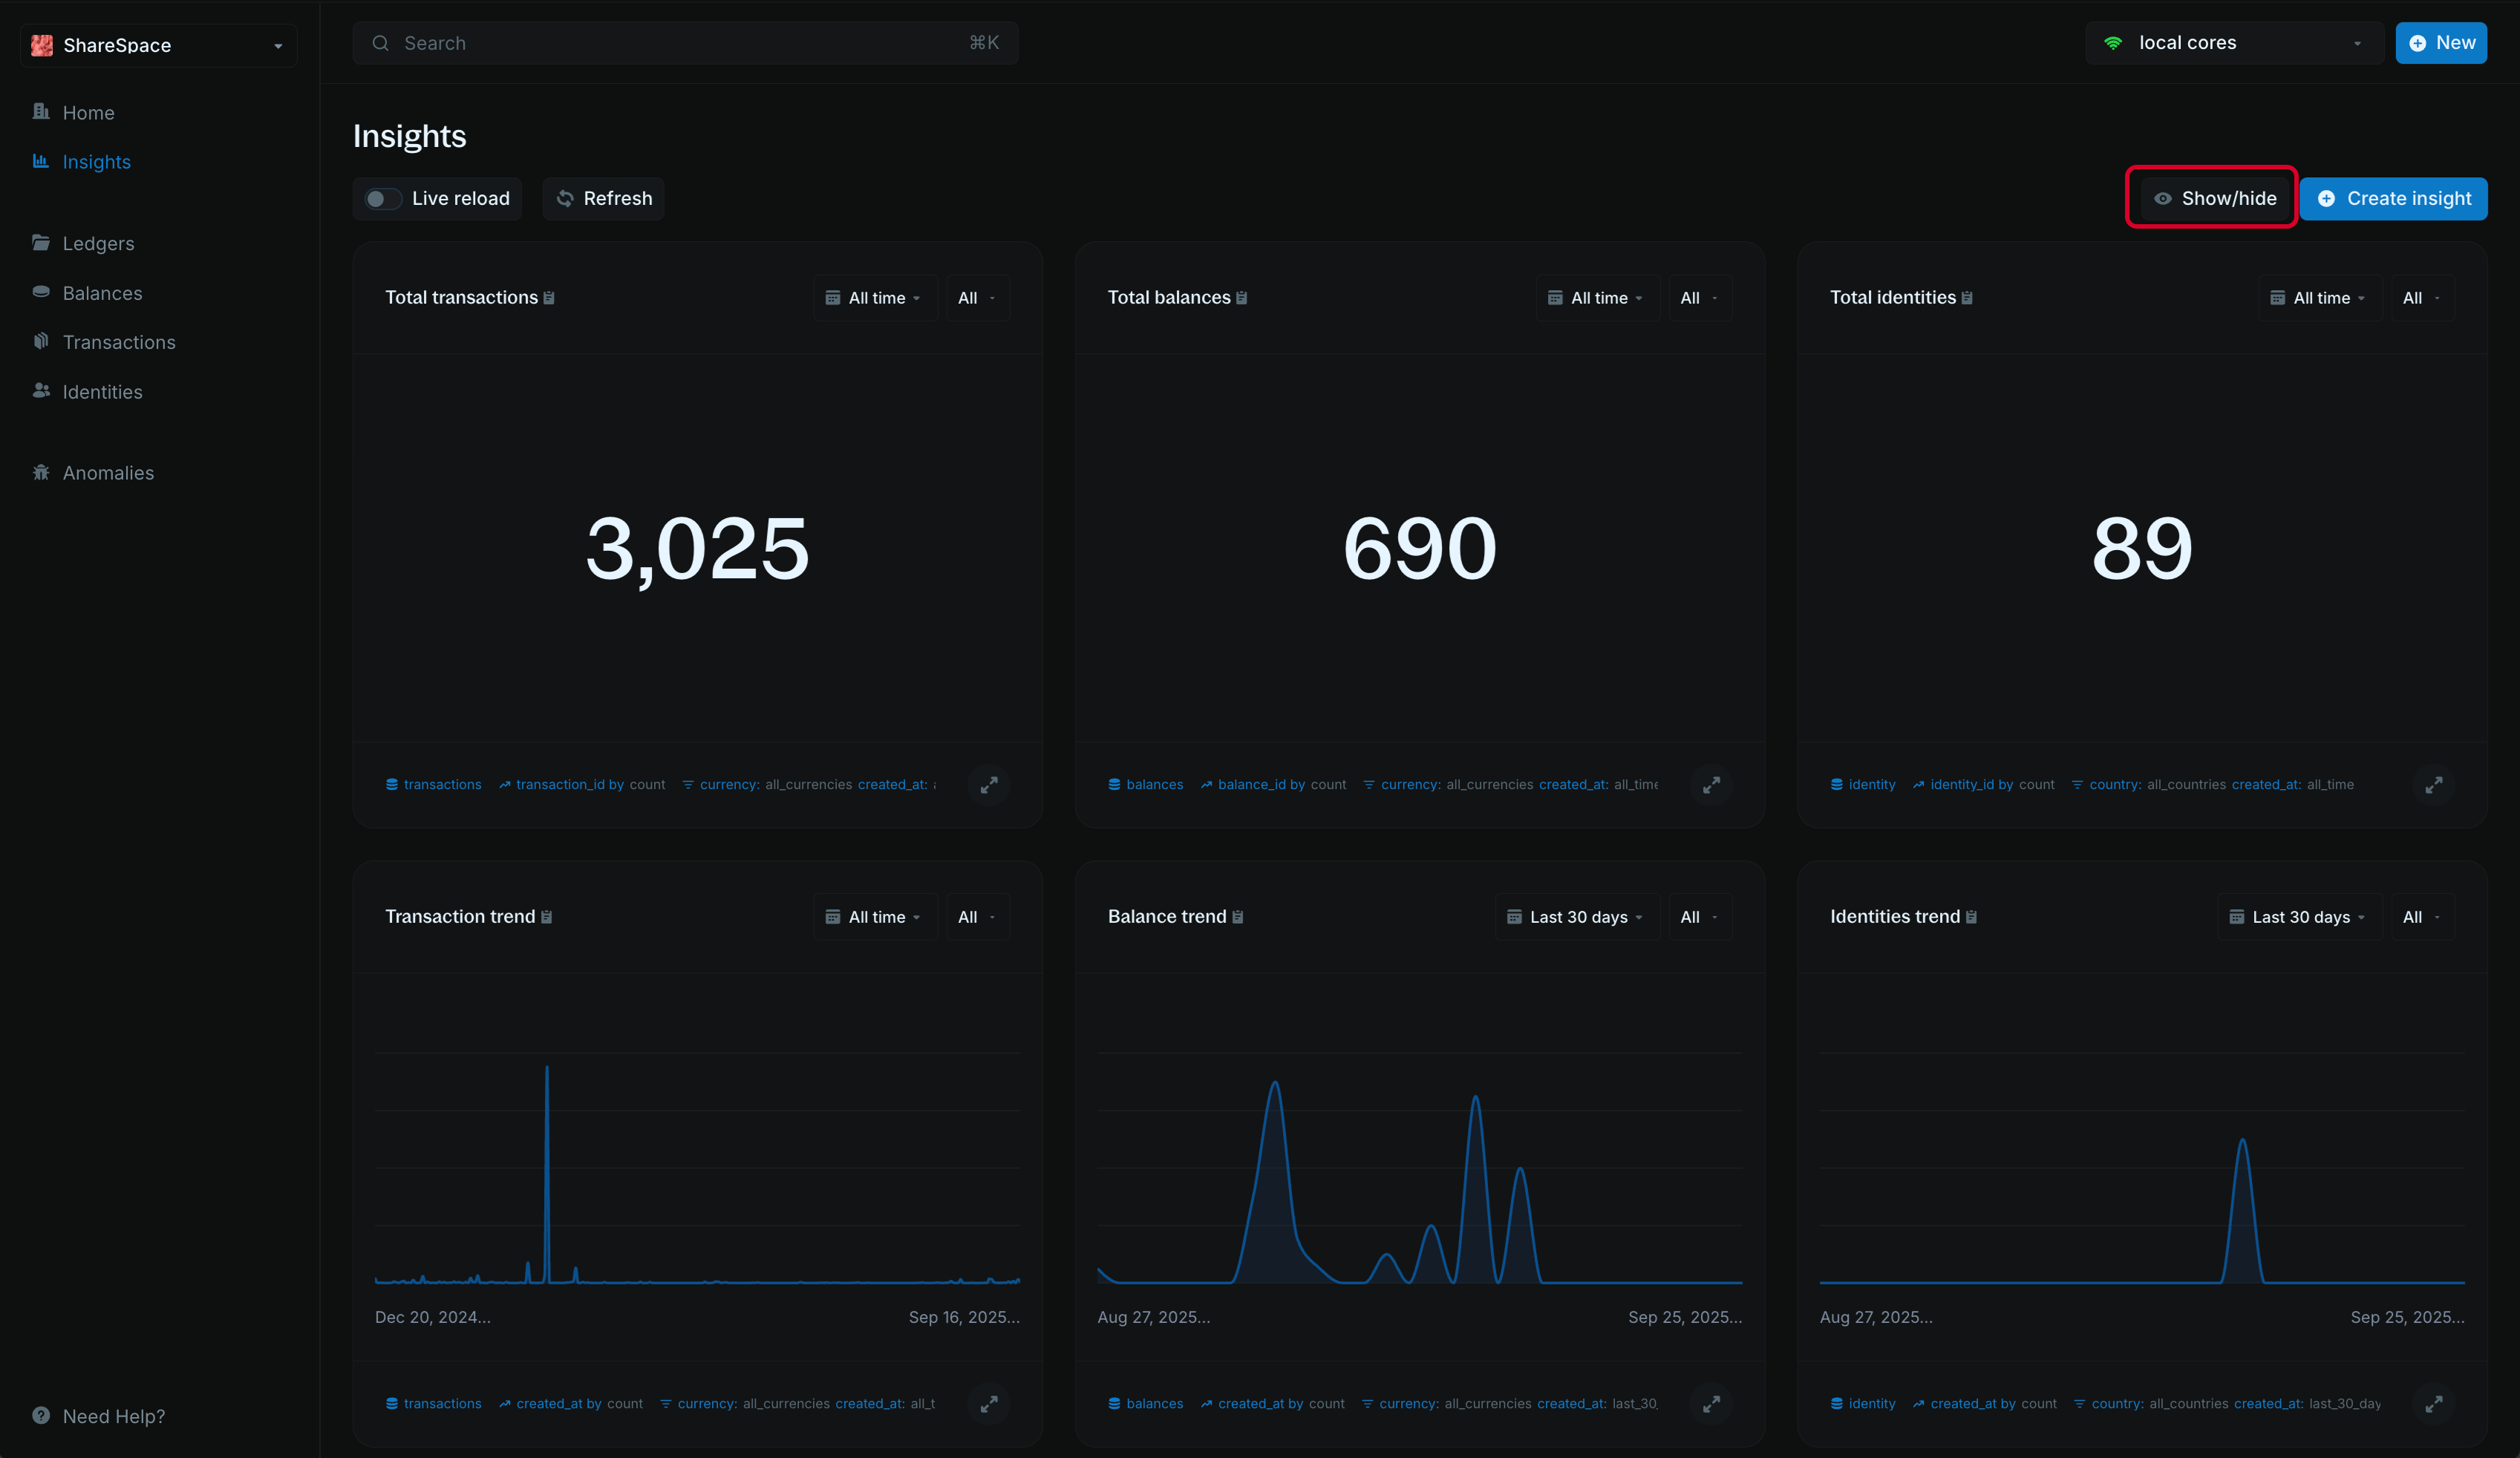
Show/hide visualizations
If you don’t need a particular visualization, you can toggle it off using the Show/Hide option. This makes it easy to focus only on the data that matters to you. To do this:- Click the Show/Hide option in the top right corner of the Insights page.
- Select which visualizations you want to show or hide.
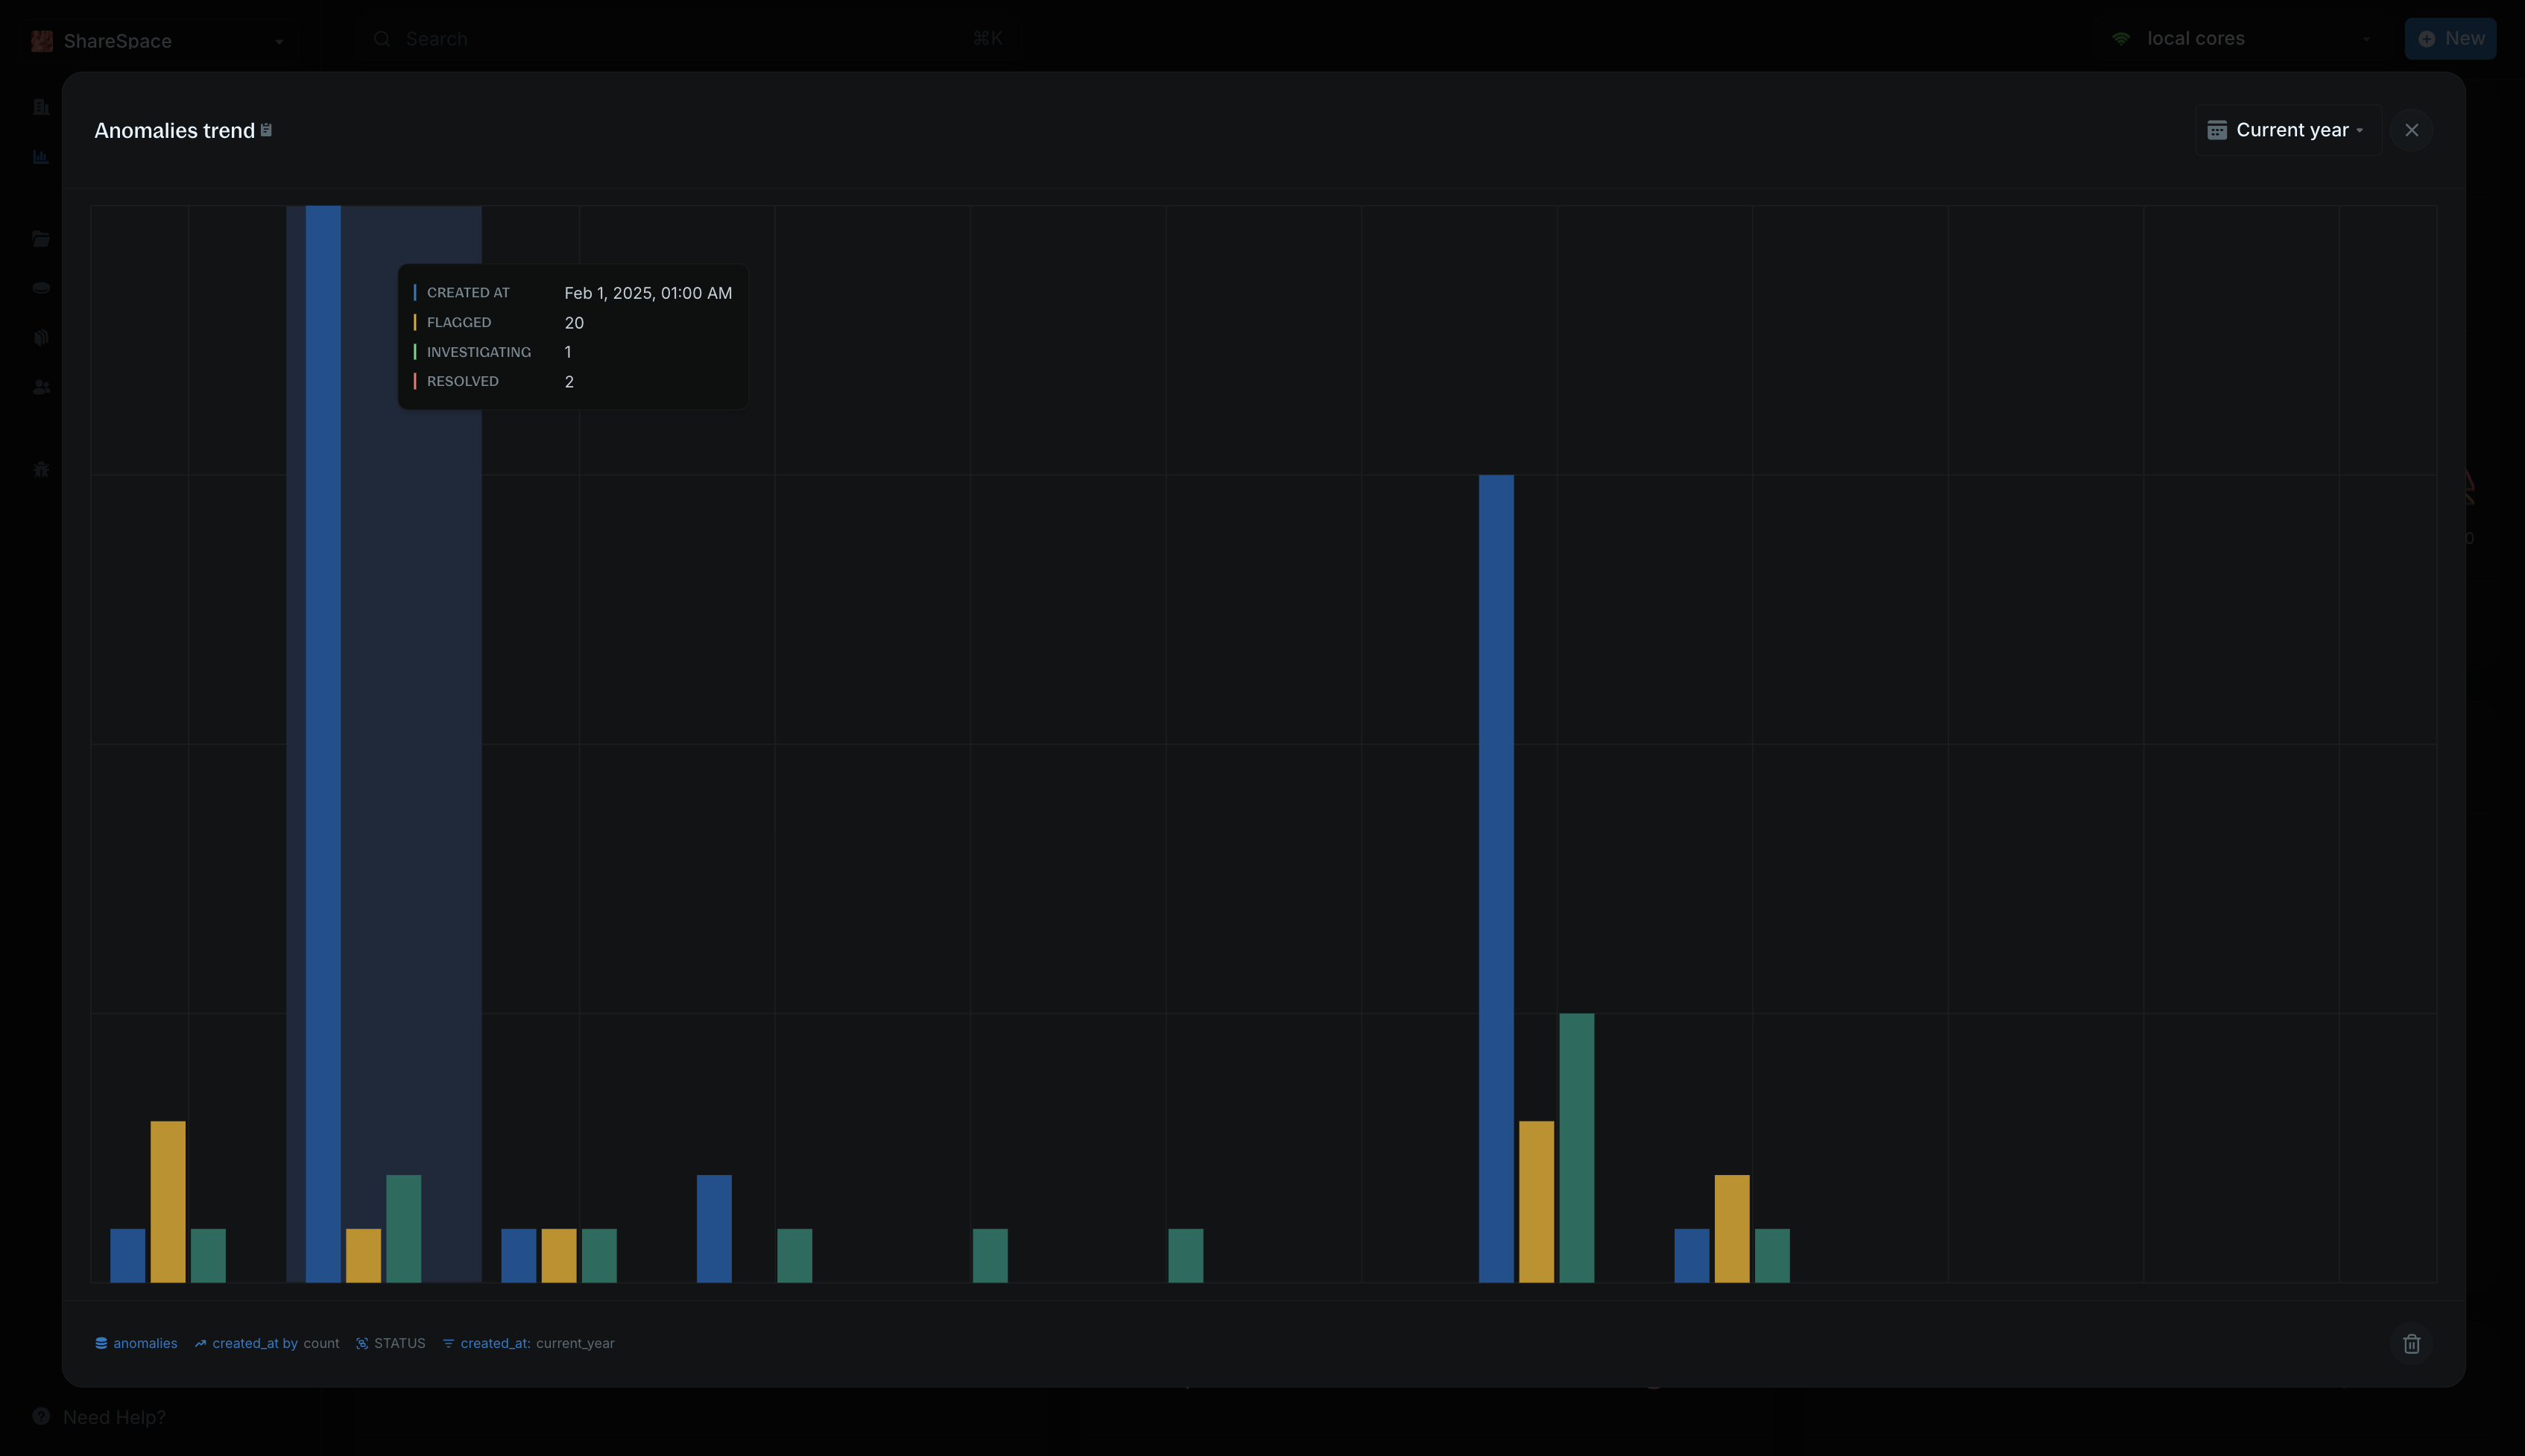
Full screen view
Insights can be opened in Full Screen view by selecting the expand icon in the bottom right corner of each visualization.