Blnk exists to give developers the tools and confidence to bring any financial product idea to life regardless of whether you’re working solo, with a small team, or as part of a large organization. Blnk Cloud is a clean and intuitive platform that allows you to view and act on your Core’s data, collaborate with your team, and monitor your transactions for any anomalies in real-time. This guide will walk you through getting started with Blnk Cloud and help you get set up quickly. Let’s get started!Documentation Index
Fetch the complete documentation index at: https://guide.cloud.blnkfinance.com/llms.txt
Use this file to discover all available pages before exploring further.
1. Sign up or log in
To access Blnk Cloud, visit cloud.blnkfinance.com.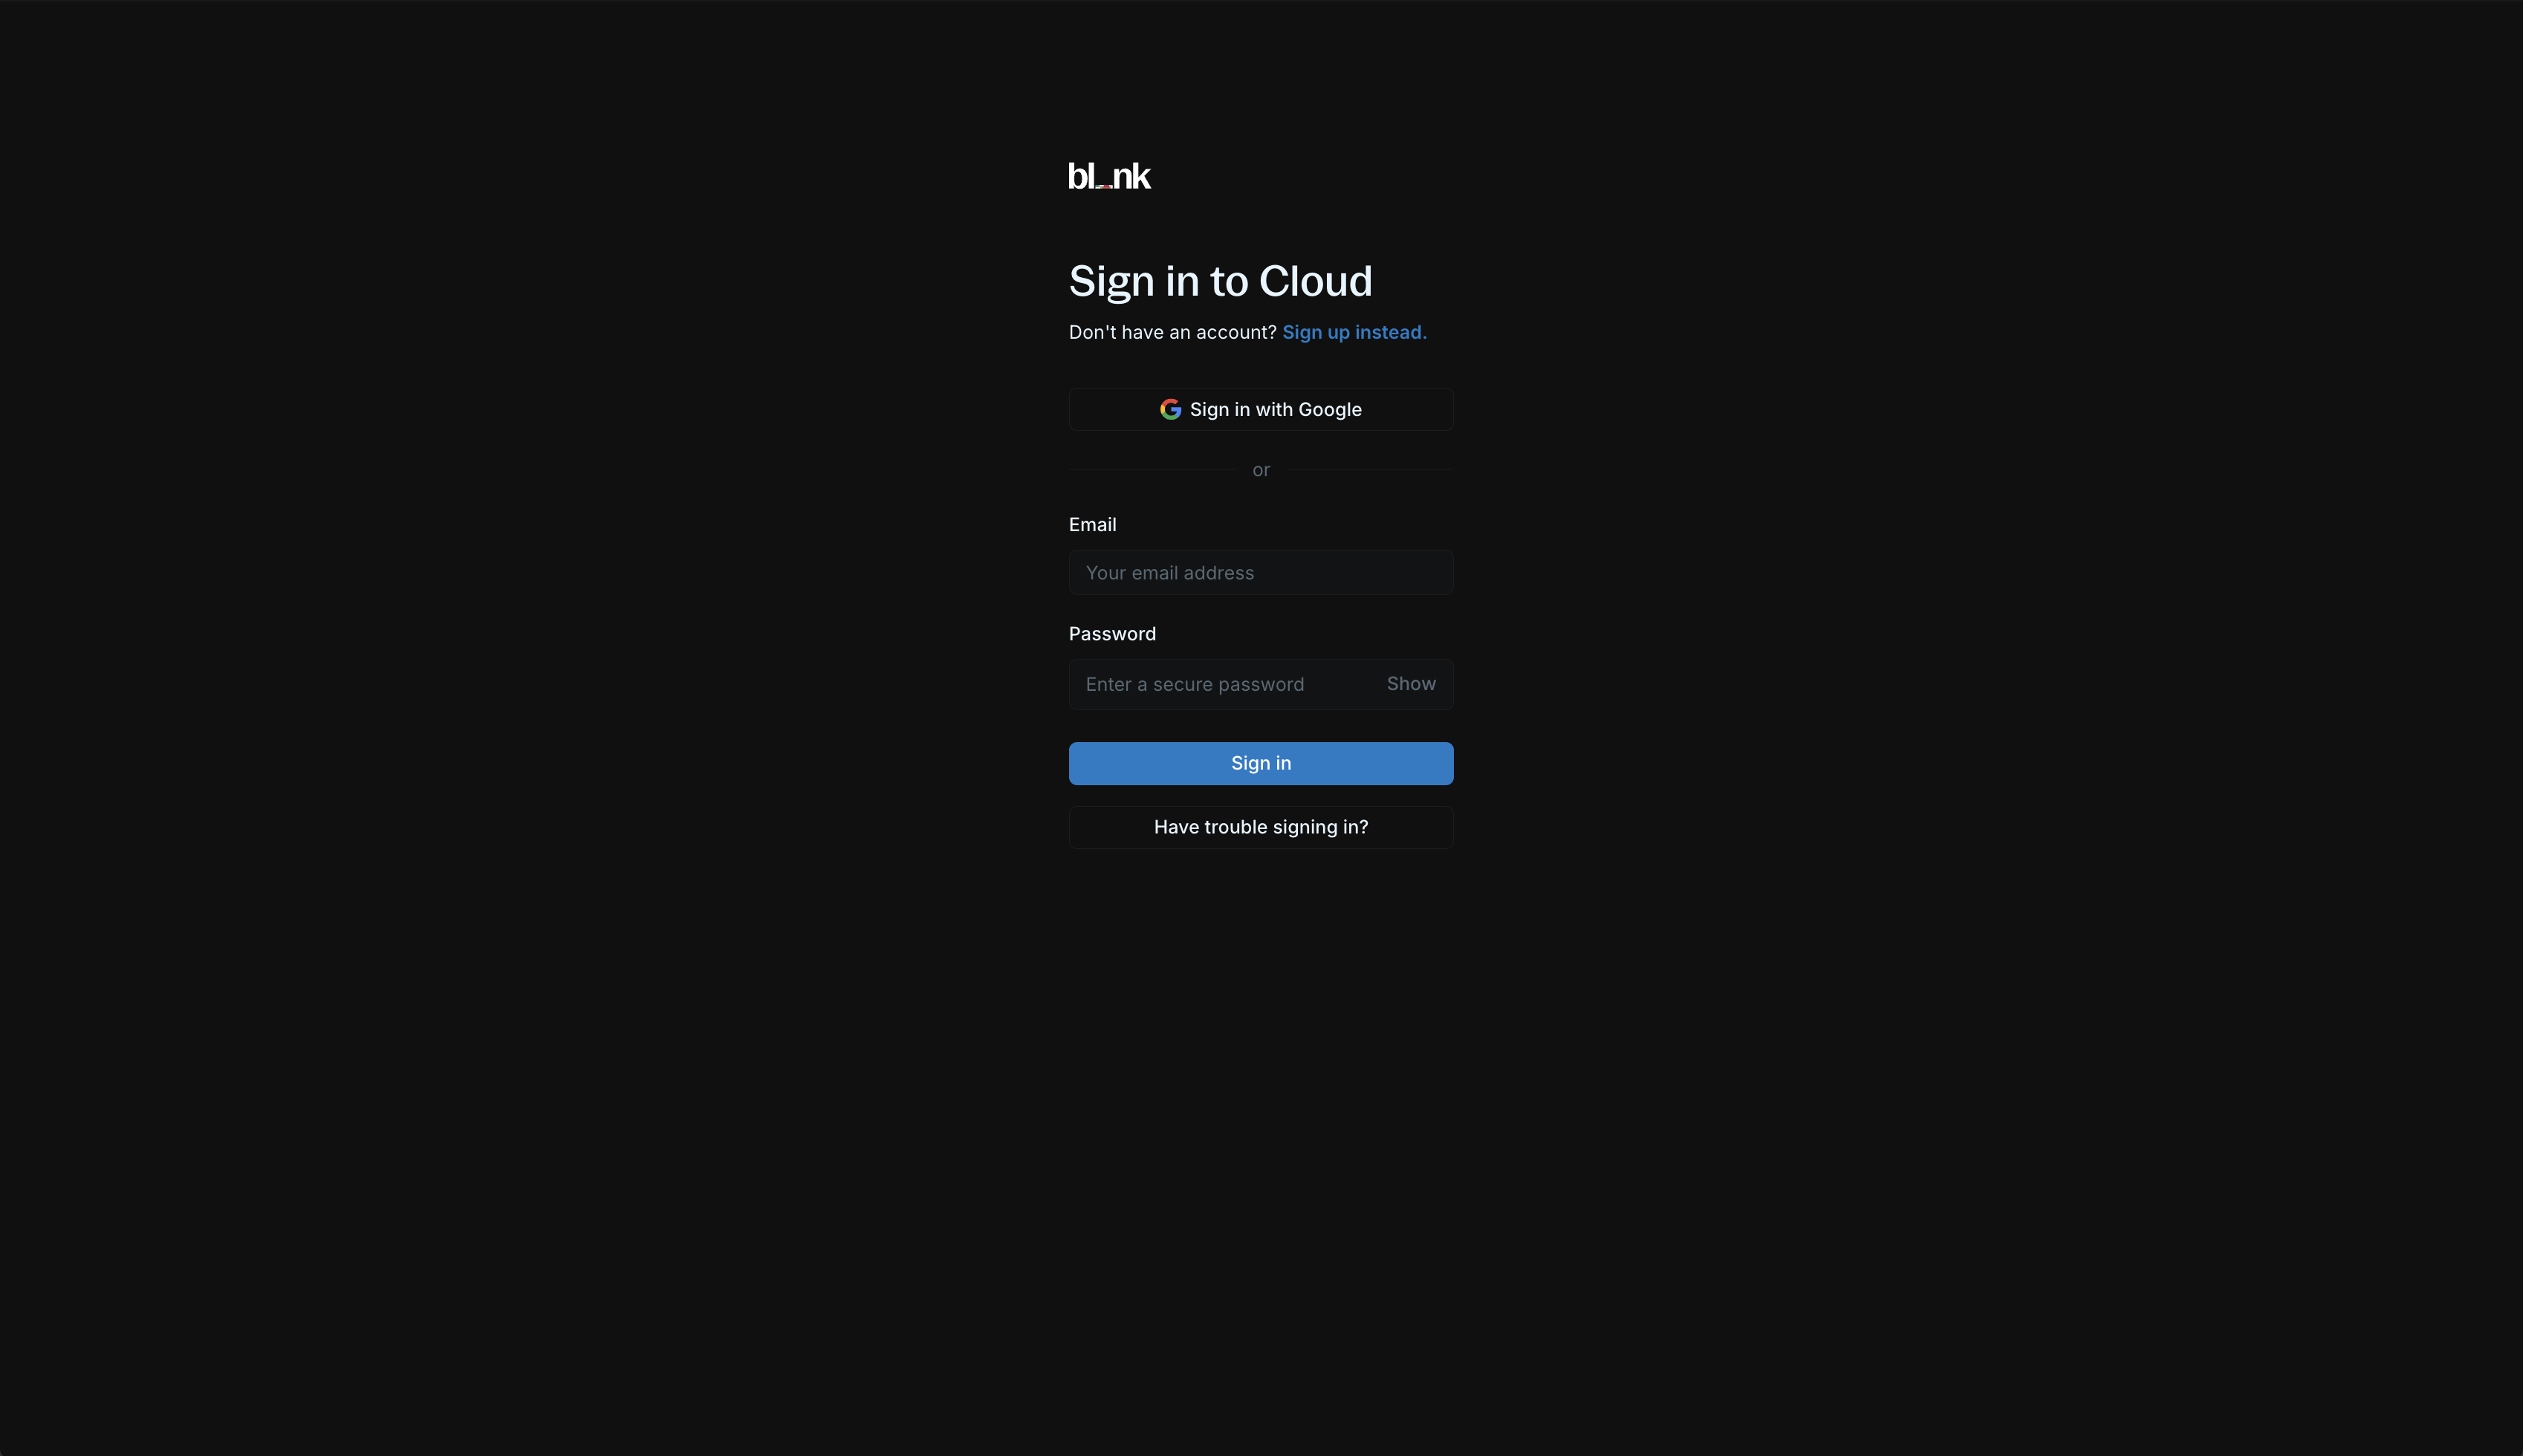
For existing users, sign in via Google or with your email and password.
2. Workspace setup
To complete your account, you need to create and set up your workspace.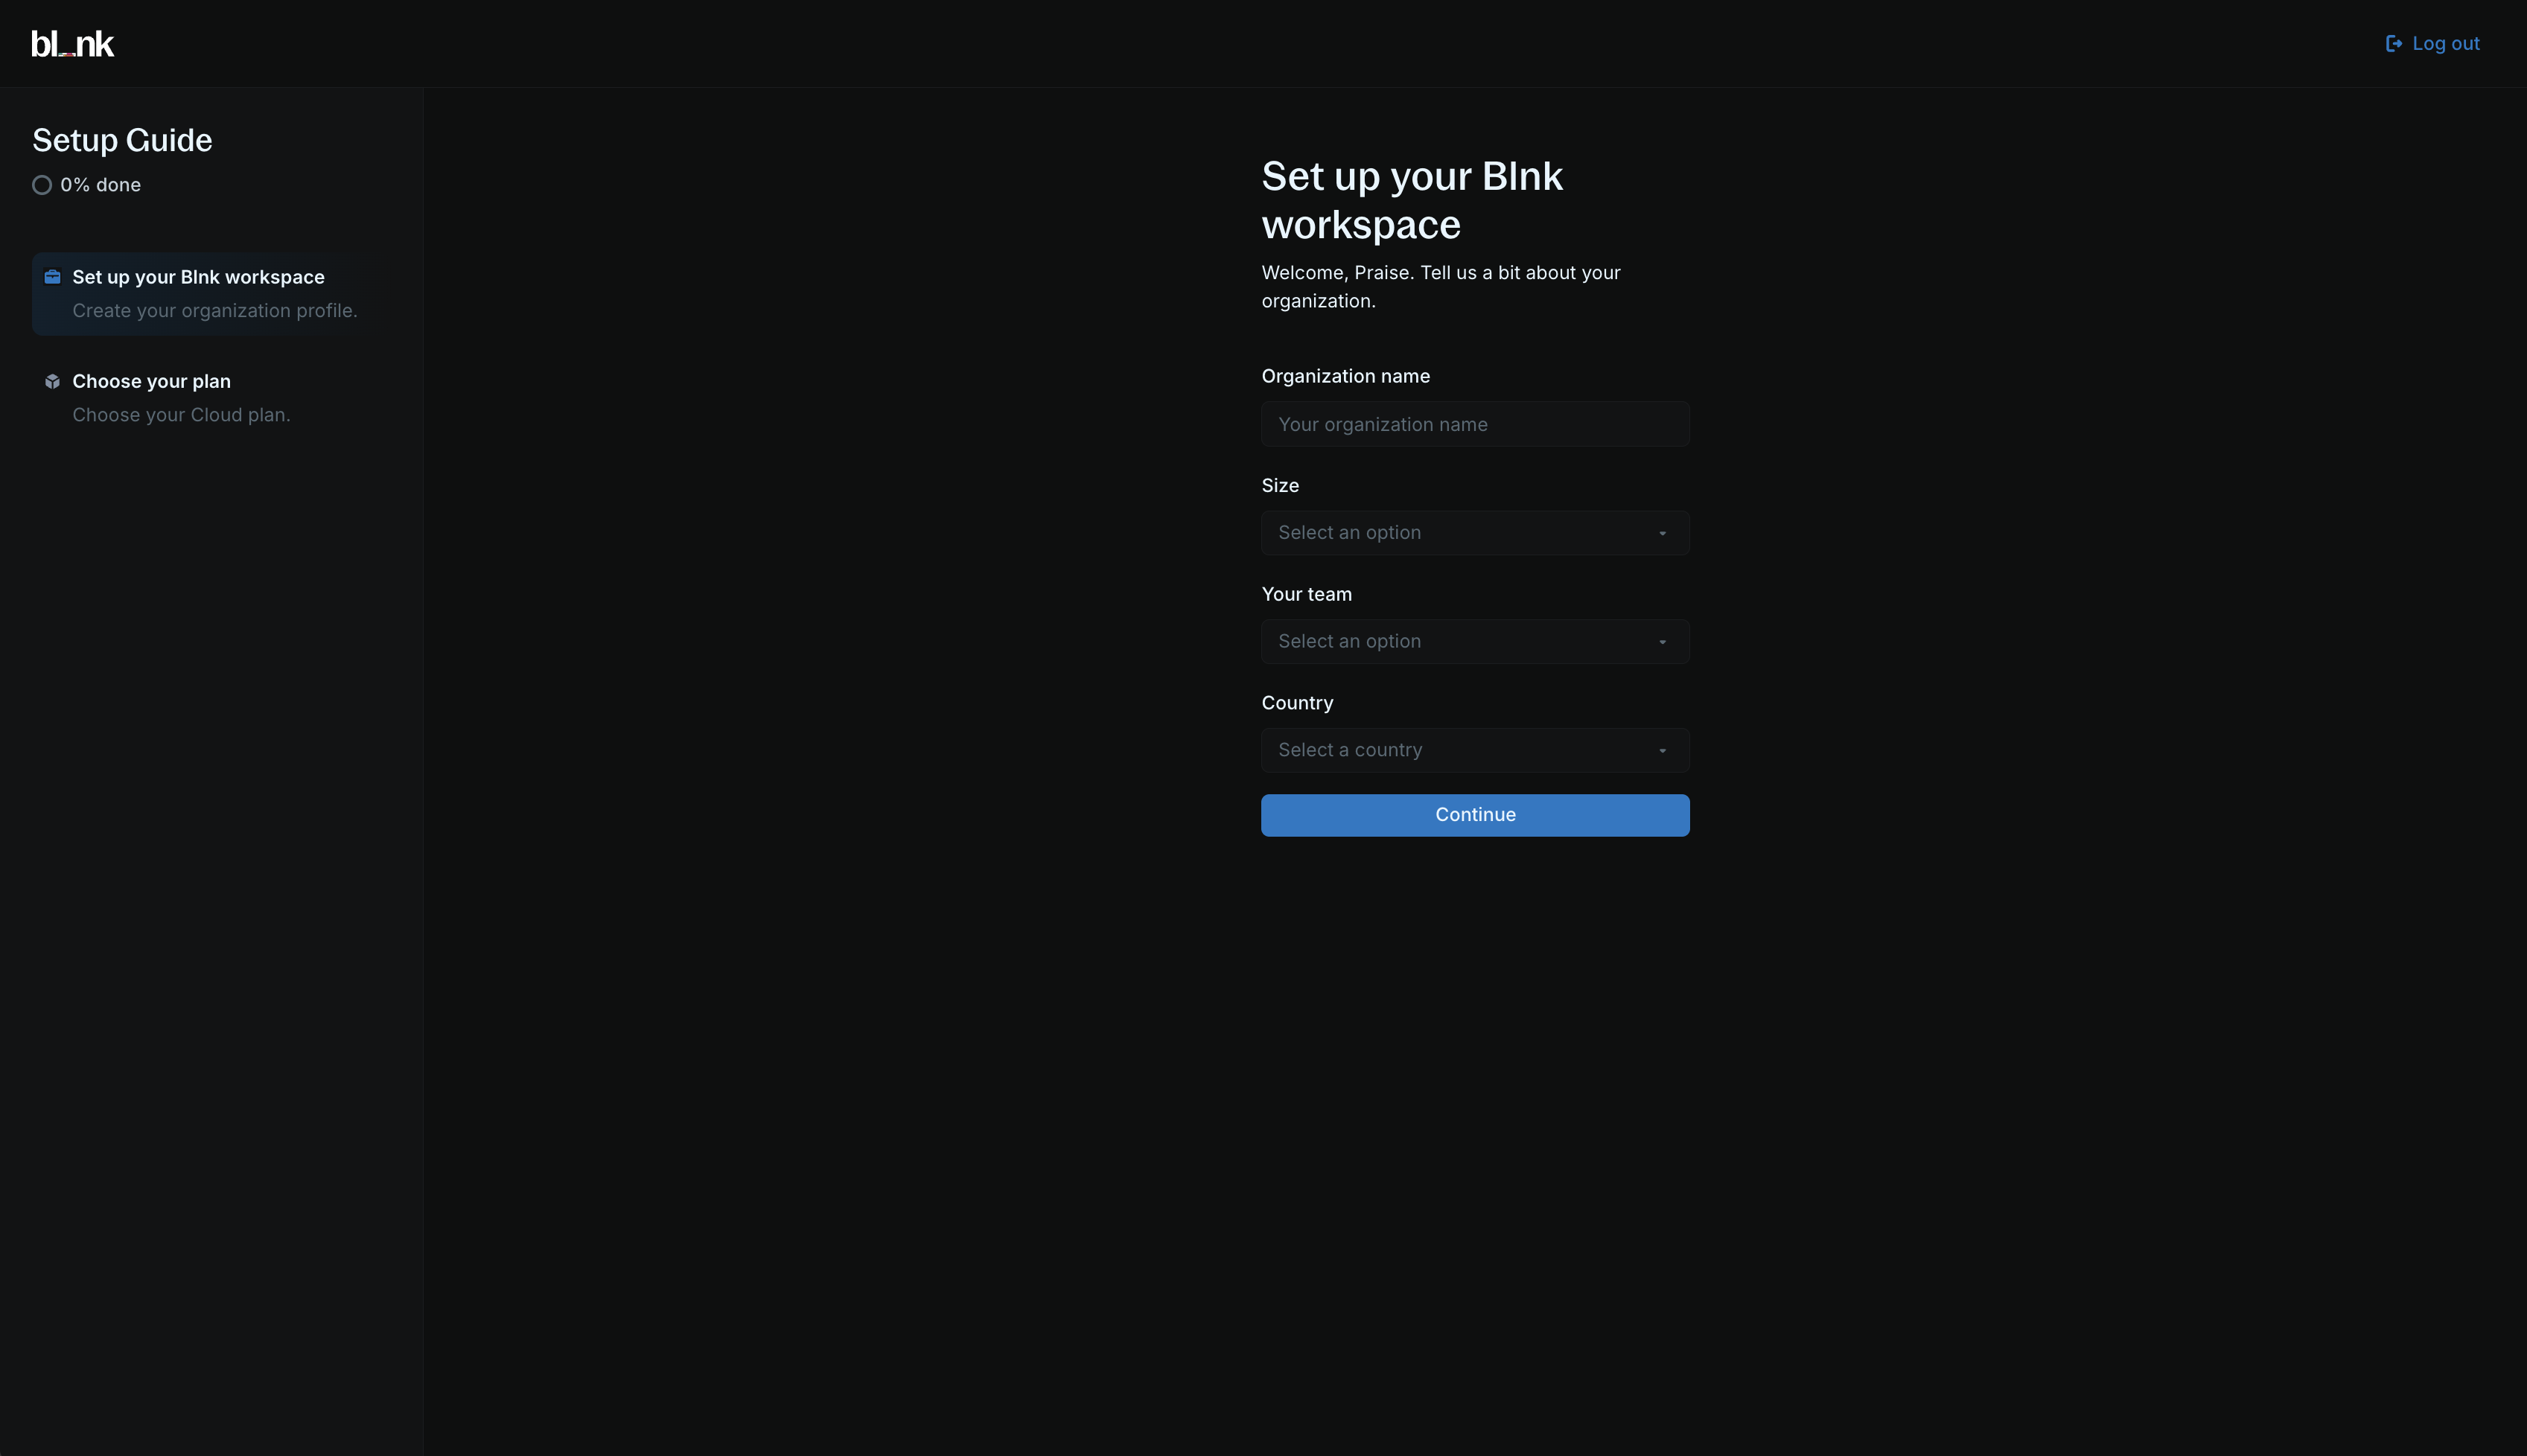
Create your organization
Enter your organization’s information:
- Organization name
- Team size
- Country
- Team
Select a Cloud plan
Select a Cloud plan that fits your needs to complete your setup and enter your workspace.Choose between our 2 plans: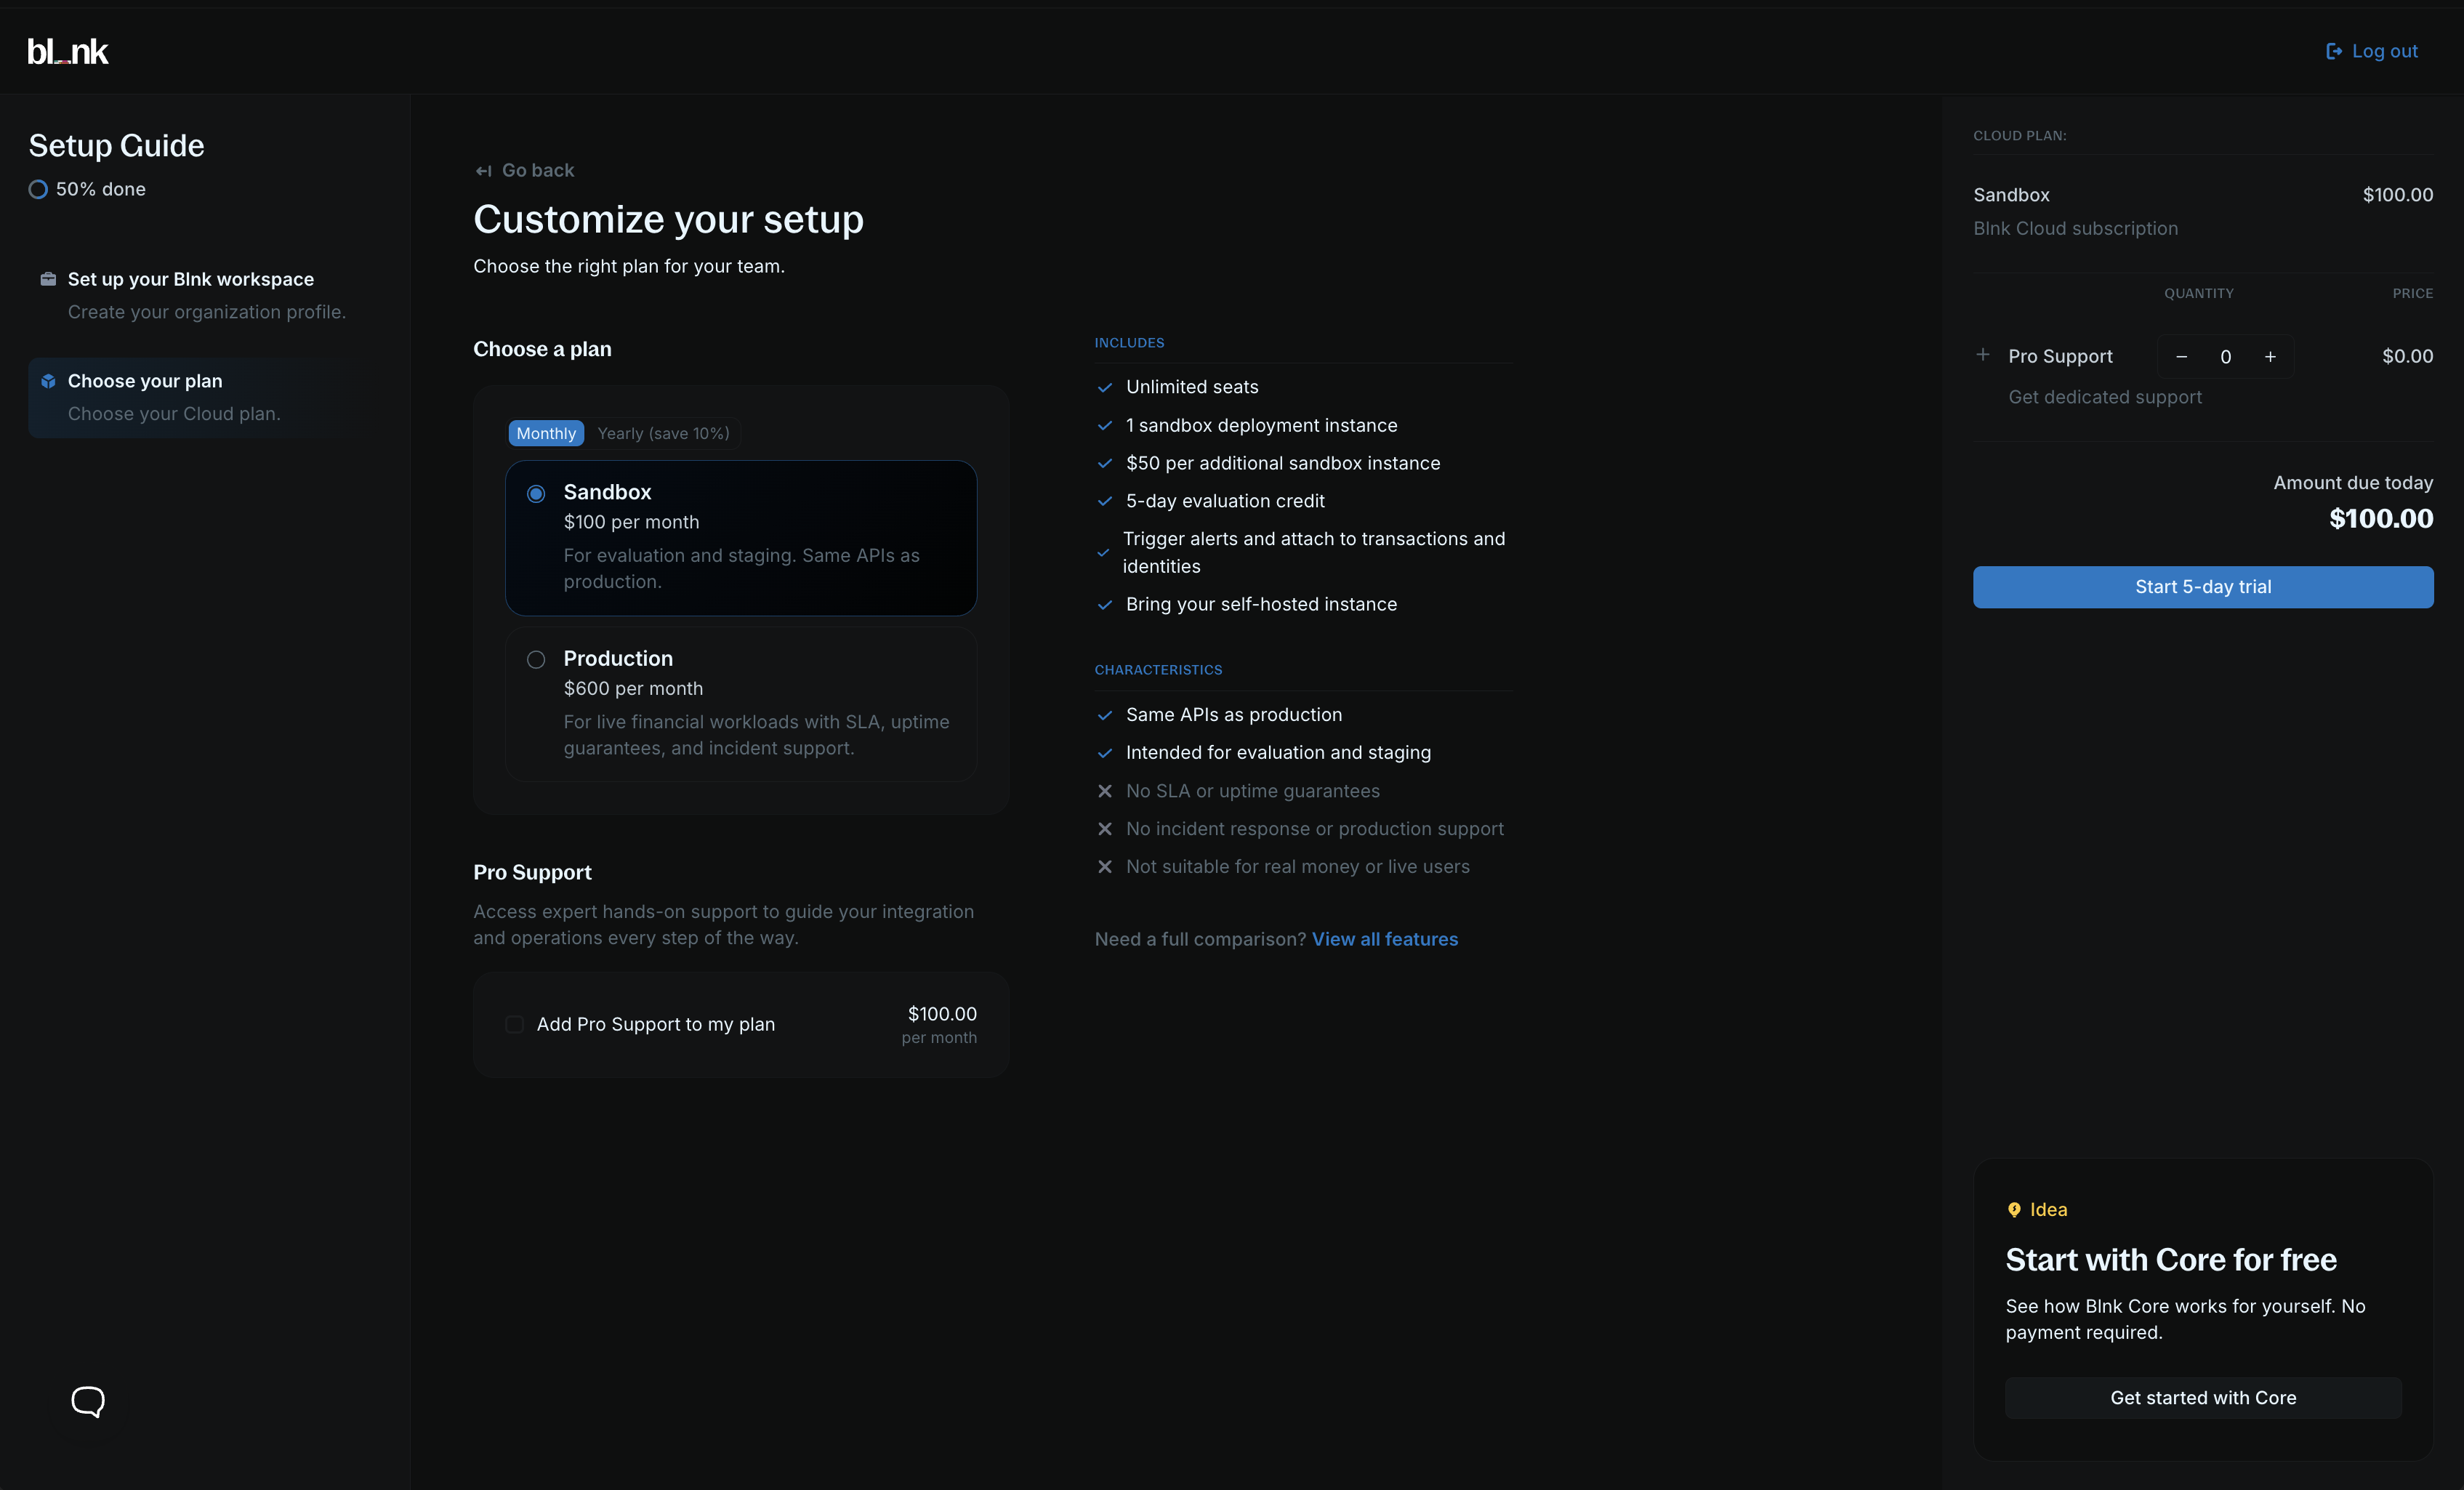
- Sandbox: Build and validate your money movement and ledger logic before going to production. Includes unlimited team members and full back-office operations.
- Production: Run your ledger and money movement in production. Includes everything in Sandbox plus automated backups, SLA & incident support, and 24/7 support.
To learn more about our plans, visit our Pricing page.
3. Deploy an instance
For Cloud to work, you need a running Blnk Core instance. You can deploy a managed instance on Blnk Cloud or connect your self-hosted instance.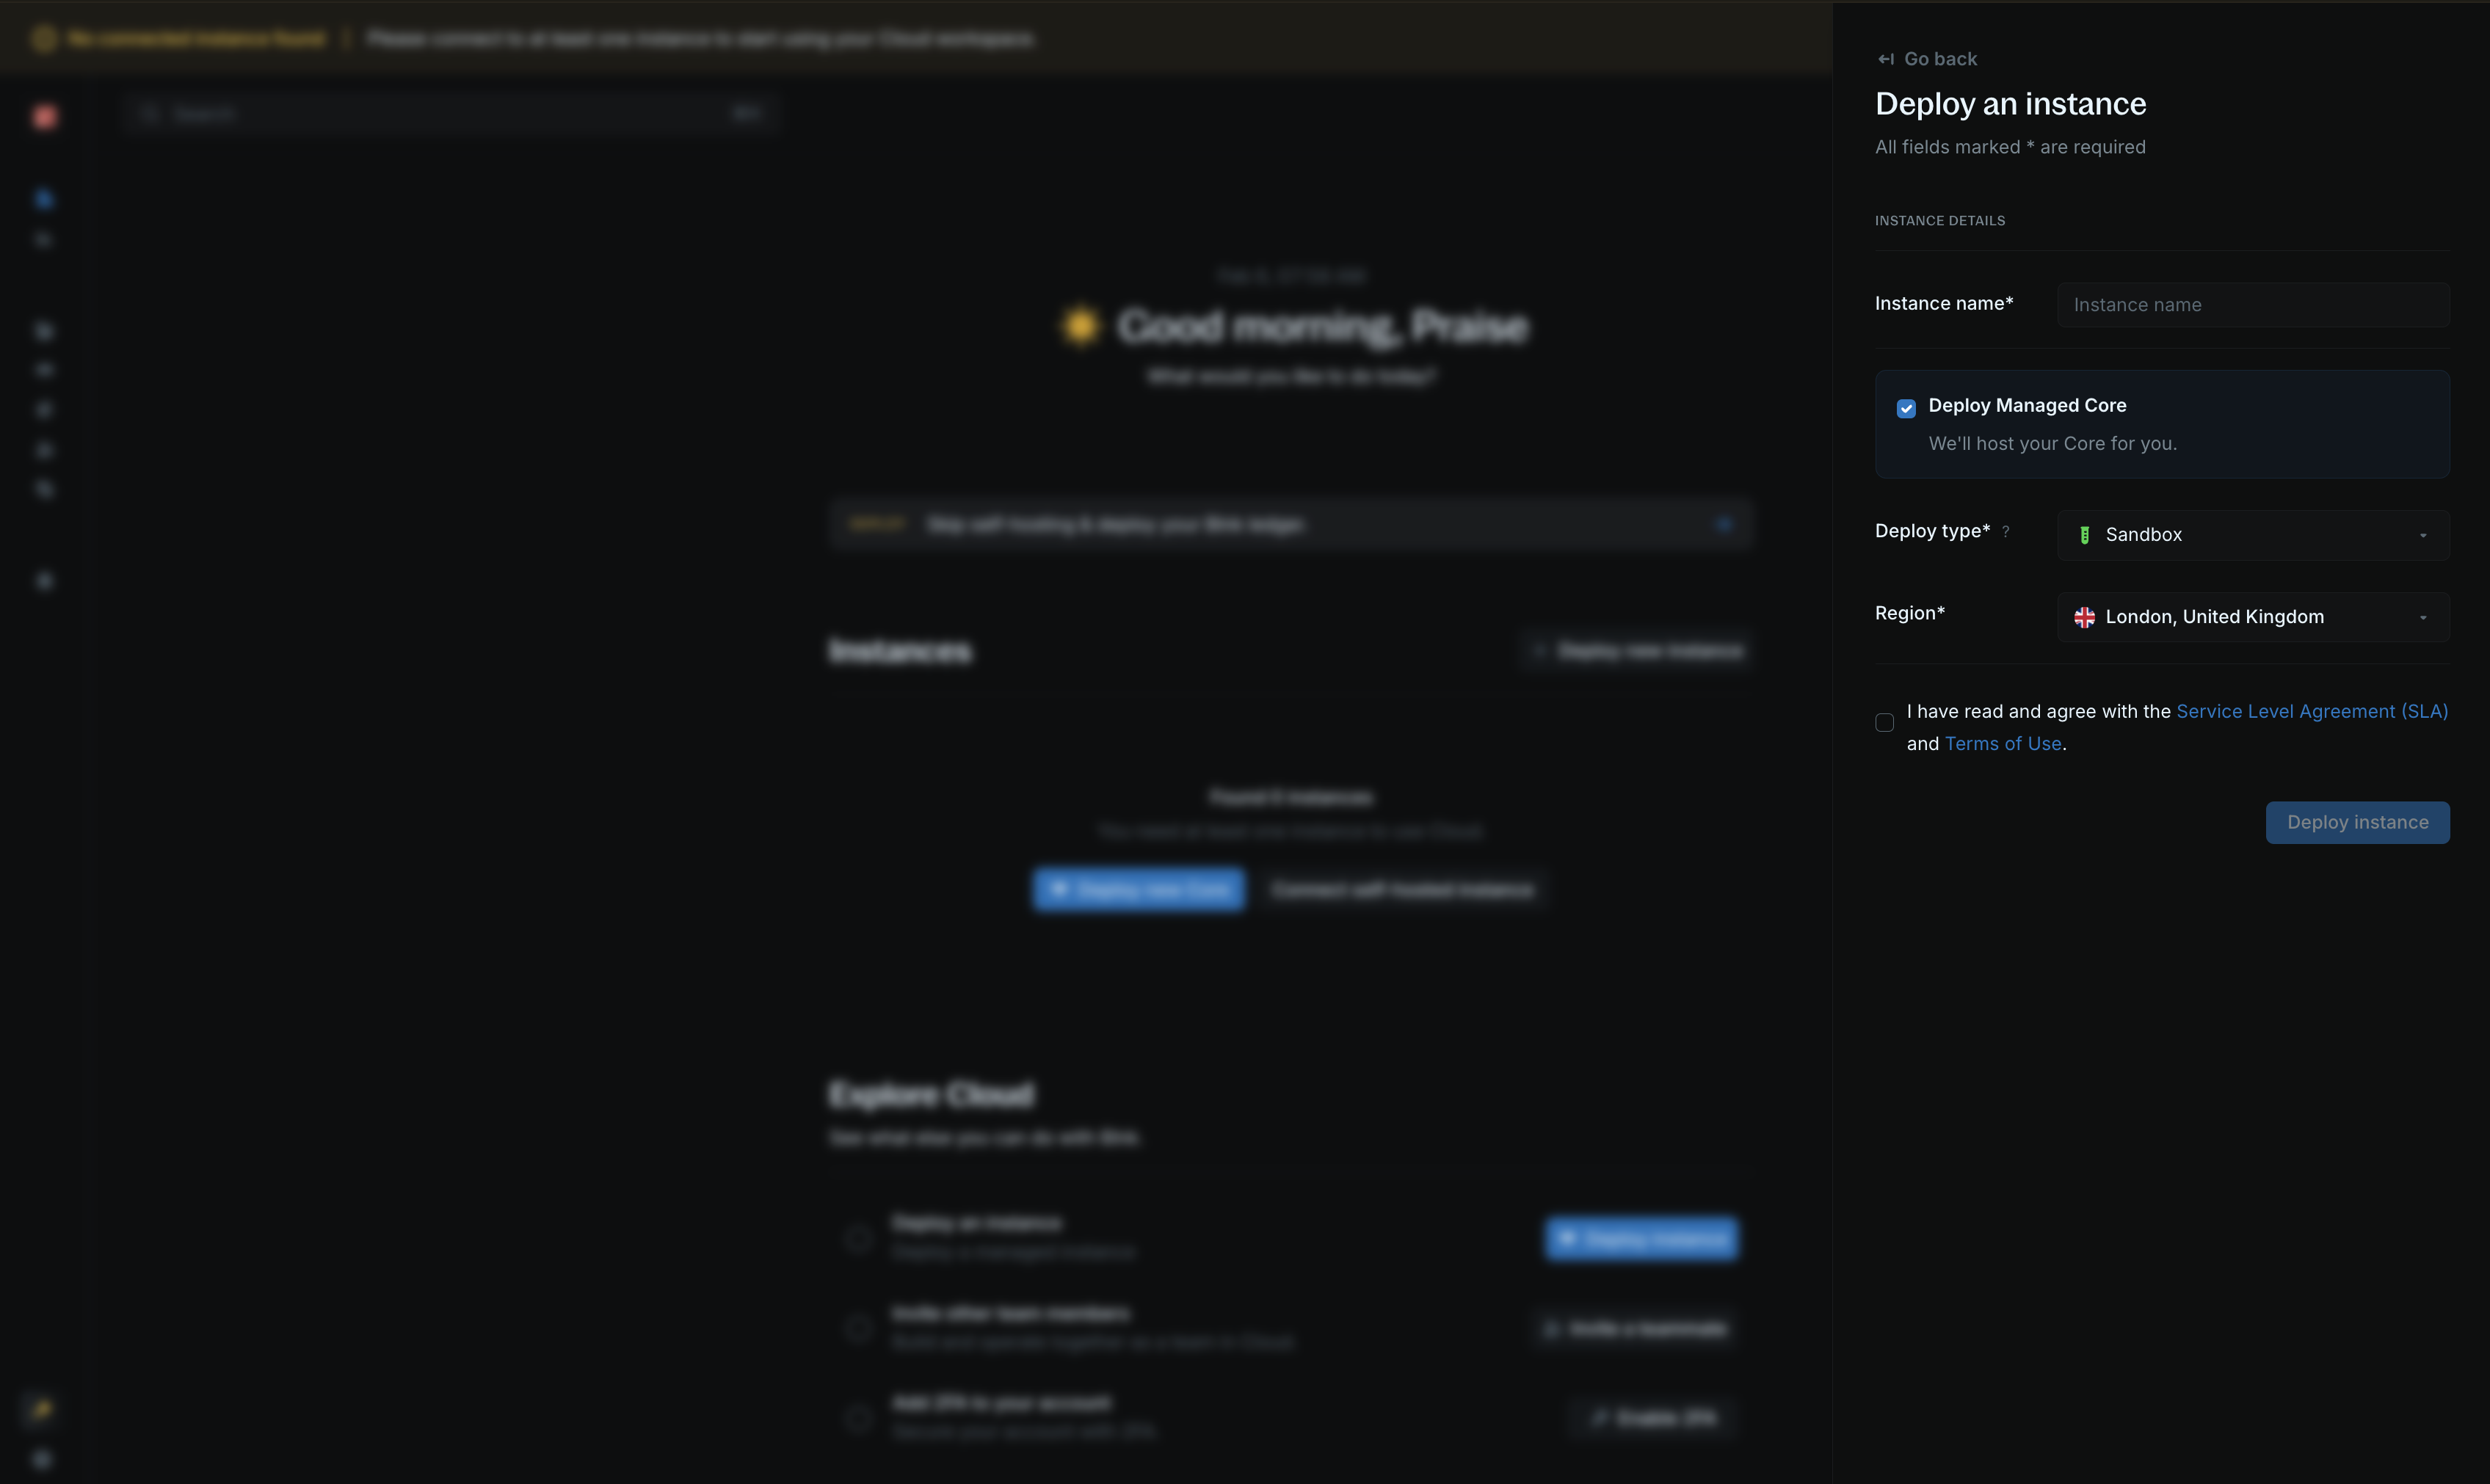
- Click Deploy new Core from your homepage.
- Choose a descriptive instance name for your instance, e.g., “Production”, “Staging”, etc. Any name works.
- Select your deployment type (B1.Micro and B1.Standard are currently available).
- Select what region you want to deploy your instance to.
- Confirm that you agree with our SLA and terms of use.
- Click on Deploy instance.
Self-hosting your Core?
Learn how to connect your self-hosted Core to Blnk Cloud.